Engagement is one of the harder things to measure at an event. Attendance, session participation, and surveys each capture a different part of the attendee experience. When these signals are combined, they provide a richer picture of how audiences engage across the event.
Time-based aggregate response data adds another useful dimension: it can show when audience response patterns changed during the event. This gives planners an additional way to connect shifts in response with specific moments in the agenda.
For organizers, the opportunity is to bring these signals together around the event objective and use them to inform future event design. This article shows a practical approach: establish a multi-signal baseline, add time-based context, interpret the evidence in context, form a design hypothesis, and test it at the next event.
Insights
Beyond Surveys: How JTB Used Emotion Data to Measure Event Engagement
2026.10.05
- # Insights
- # Event Solution
- # Asia
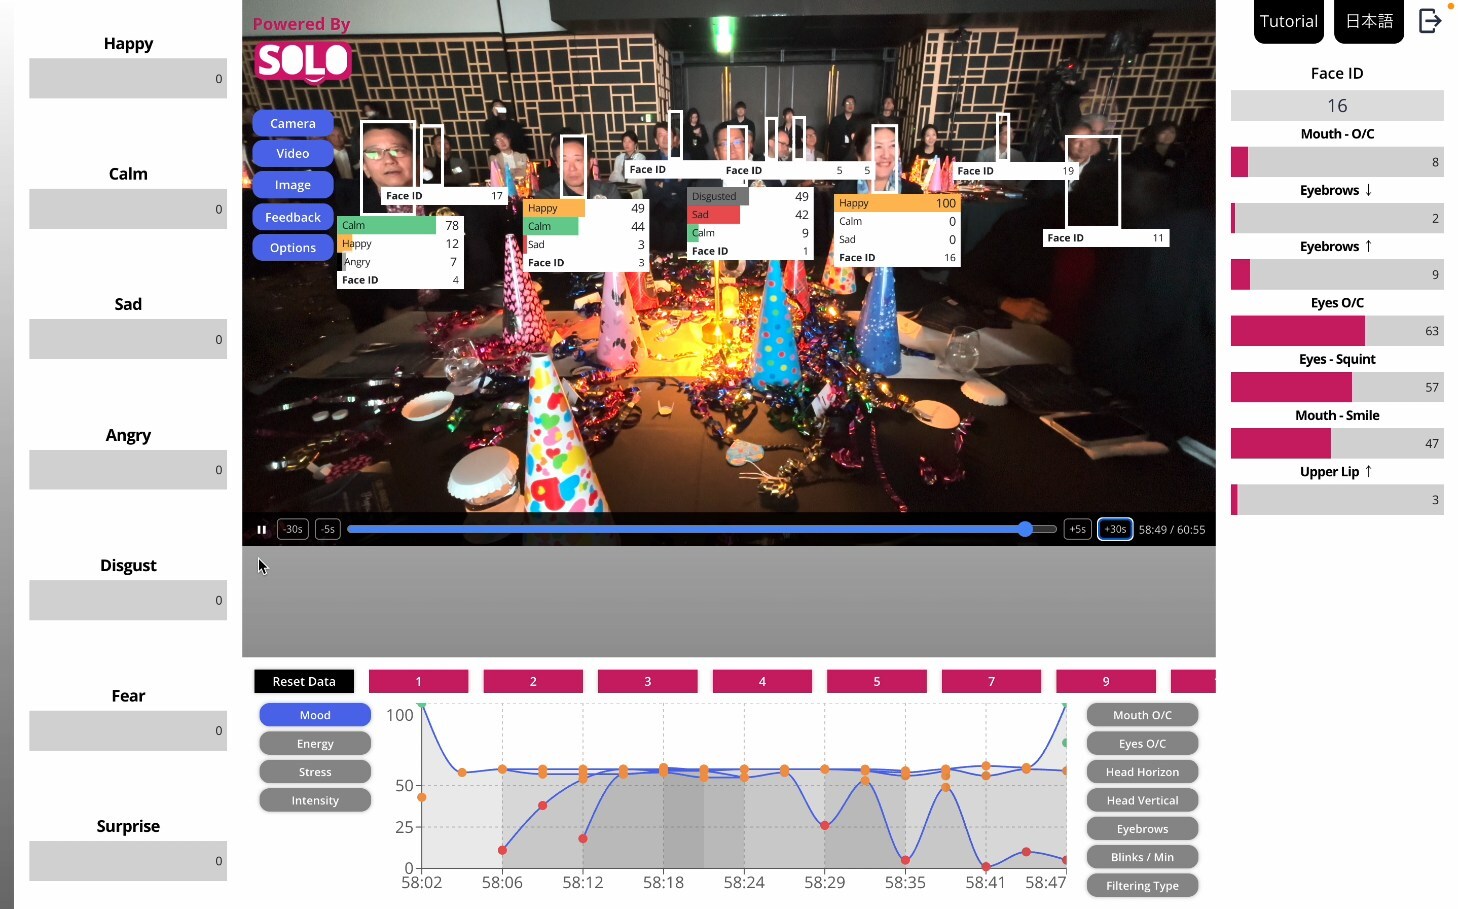
Measure. Learn. Redesign.
From post-event measurement to continuous event optimization
JTB's approach shows how time-based audience response data can work alongside established engagement metrics to turn event measurement into design hypotheses for the next event.
What Is Event Engagement?
Event engagement is a multidimensional concept that can include attention, participation, interaction, response, understanding, direct feedback, and follow-through across an event. It is not the same as attendance, which records presence, or satisfaction, which records a stated judgment after the fact. An event can score well on both and still lose the room during a critical segment.
Because the event objective determines what meaningful engagement looks like, the signals should be chosen against that objective rather than a universal score. A product launch, leadership summit, and partner conference ask different things of their audiences.
Engagement is therefore multidimensional, and no single instrument captures it all.
How Is Event Engagement Measured?
In practice, measure event engagement by combining several signal categories: attendance and participation duration, session-level interaction such as polls and Q&A, digital and app activity, and direct feedback through surveys or NPS. Select the mix that matches the event objective.
Each signal answers a different question. The strongest picture emerges when multiple signals are combined around the event objective.
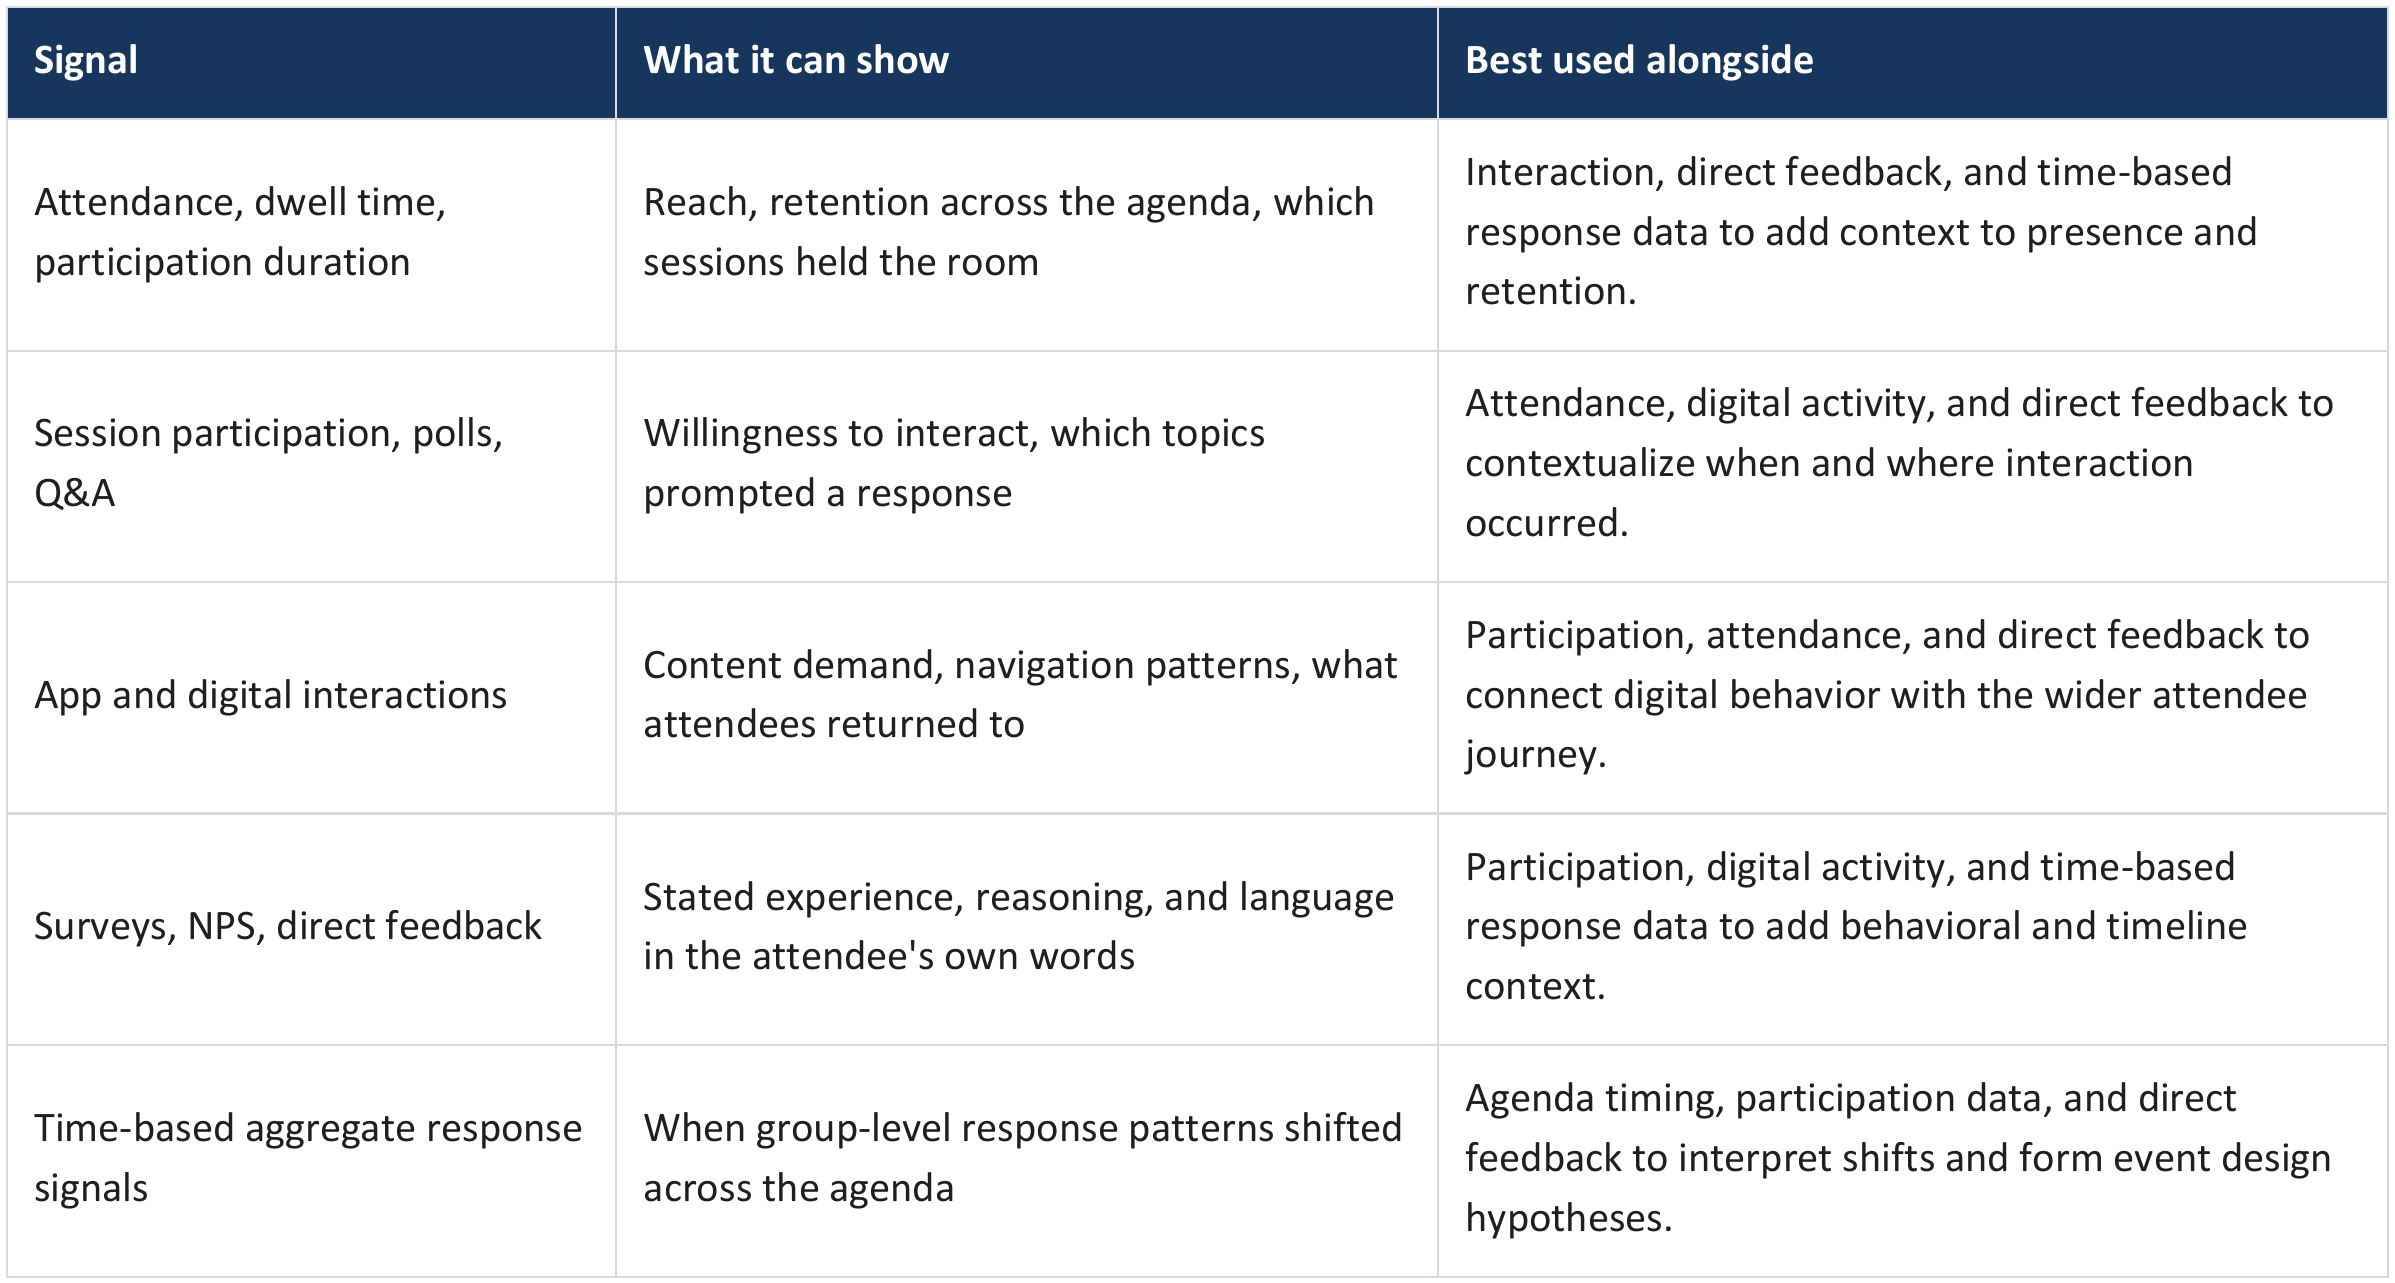
Together, these signals cover different questions, but most still have limited moment-to-moment resolution. Surveys capture reflection after the event, while many behavioral measures operate at session level. That is where a time-based layer can add context.
For a fuller reference on conventional engagement KPIs, see JTB's white paper on Metrics to Track Attendee Engagement. The rest of this article focuses on the layer that sits alongside them.
What Emotion Data Adds to Event Analytics
Time-based emotion-related data mainly adds temporal resolution: it can show when observable group-level response patterns changed.
What Signals Can Be Measured?
Time-series analysis looks at sequence rather than a single total. It can show where response was steady, where it moved, and how long a shift lasted. Research on facial dynamics indicates that sequence, duration, transition, and time-window structure can carry information a single aggregate value does not.
The specific signals depend on the tool and study design.
Connecting Response Patterns to the Event Timeline
Because a pattern change is not an explanation, interpretation should be deliberate:
2. Check what was happening in the event then, using the agenda, run sheet, and production notes.
3. Compare that moment against other evidence: participation data, app activity, and what attendees said.
4. Form a hypothesis about what may explain the change, and label it as one.
At each step, language should match the evidence: a pattern change coincided with a segment, and other evidence may suggest an explanation. Co-occurrence does not establish cause; content, delivery, room conditions, and agenda timing may all matter.
How JTB Used Emotion Data in an Event Pilot
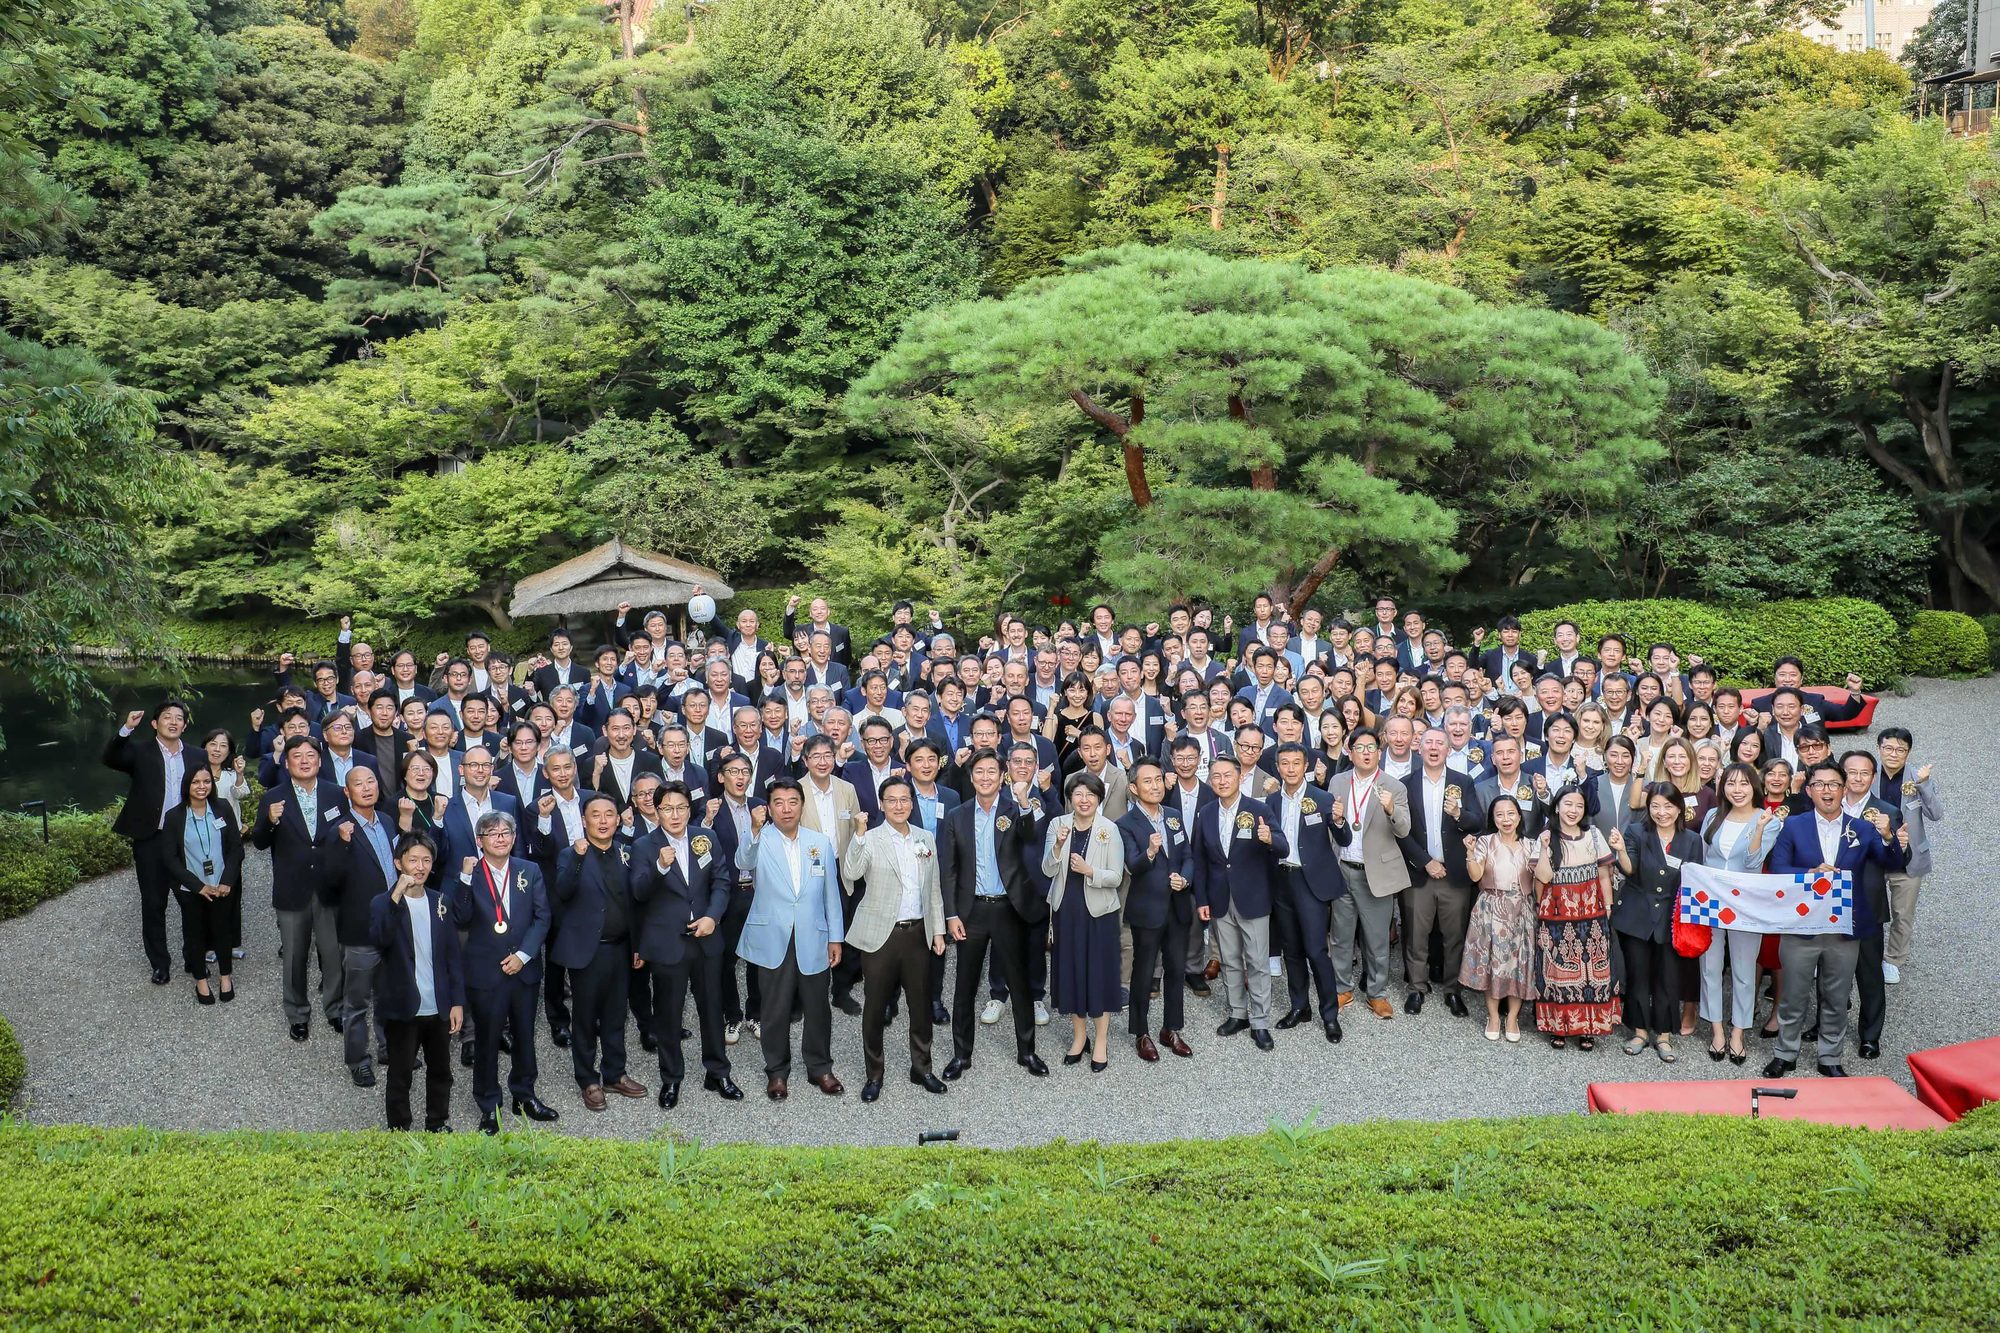
At GBU AWARDS 2025, we ran a pilot, held on July 22, 2026, at HAPPO-EN in a hybrid format. The awards program recognizes achievements and shares ideas and know-how across our Global Business Unit. The event brought together 170 attendees in person and 631 online. The aim of the pilot was to test this measurement logic in a live setting. This section covers the method; the observations follow.
What JTB Measured
The analysis used AI-based facial expression analysis technology validated against the Facial Action Coding System (FACS), developed by psychologist Paul Ekman and colleagues. Aggregate audience response was captured as a time series across the event and compared across content segments and groups. The analysis tracked 50 content segments for seven audience tables, with three video blocks analyzed per table. That structure shows whether a pattern appeared broadly or was concentrated in one group.
Measures included labels such as Mood, Energy, Wellbeing, Stress, and Intensity. These labels are analysis constructs used to compare aggregate response patterns over time, rather than a universal engagement scale or a reading of any individual's emotional state.
How the Analysis Was Conducted
The analysis was conducted at aggregate, group level, comparing repeated outputs across chronological content segments and groups.
What the Data Revealed About Audience Response
The data did not simply tell us whether the event was ”successful.” It showed us where audience response changed - and gave us new questions to ask about why.
Three observations illustrate how time-based response data can inform event design decisions.
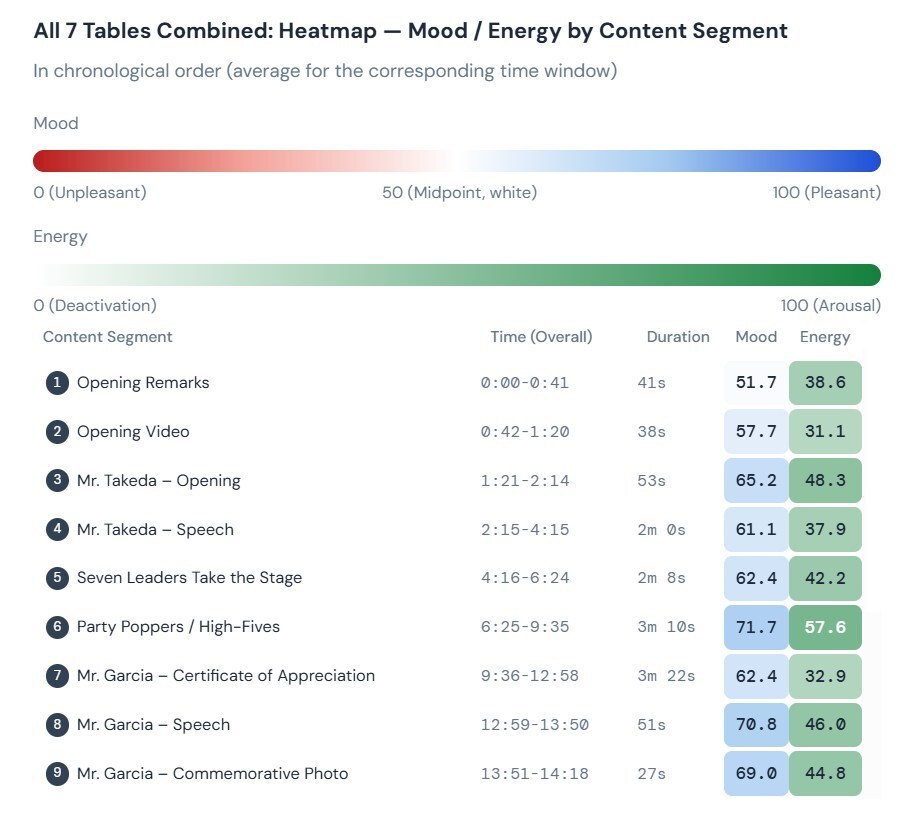
Aggregate response patterns varied across content categories and moments. This shows the measurement could distinguish parts of the agenda that a single post-event score would average together.
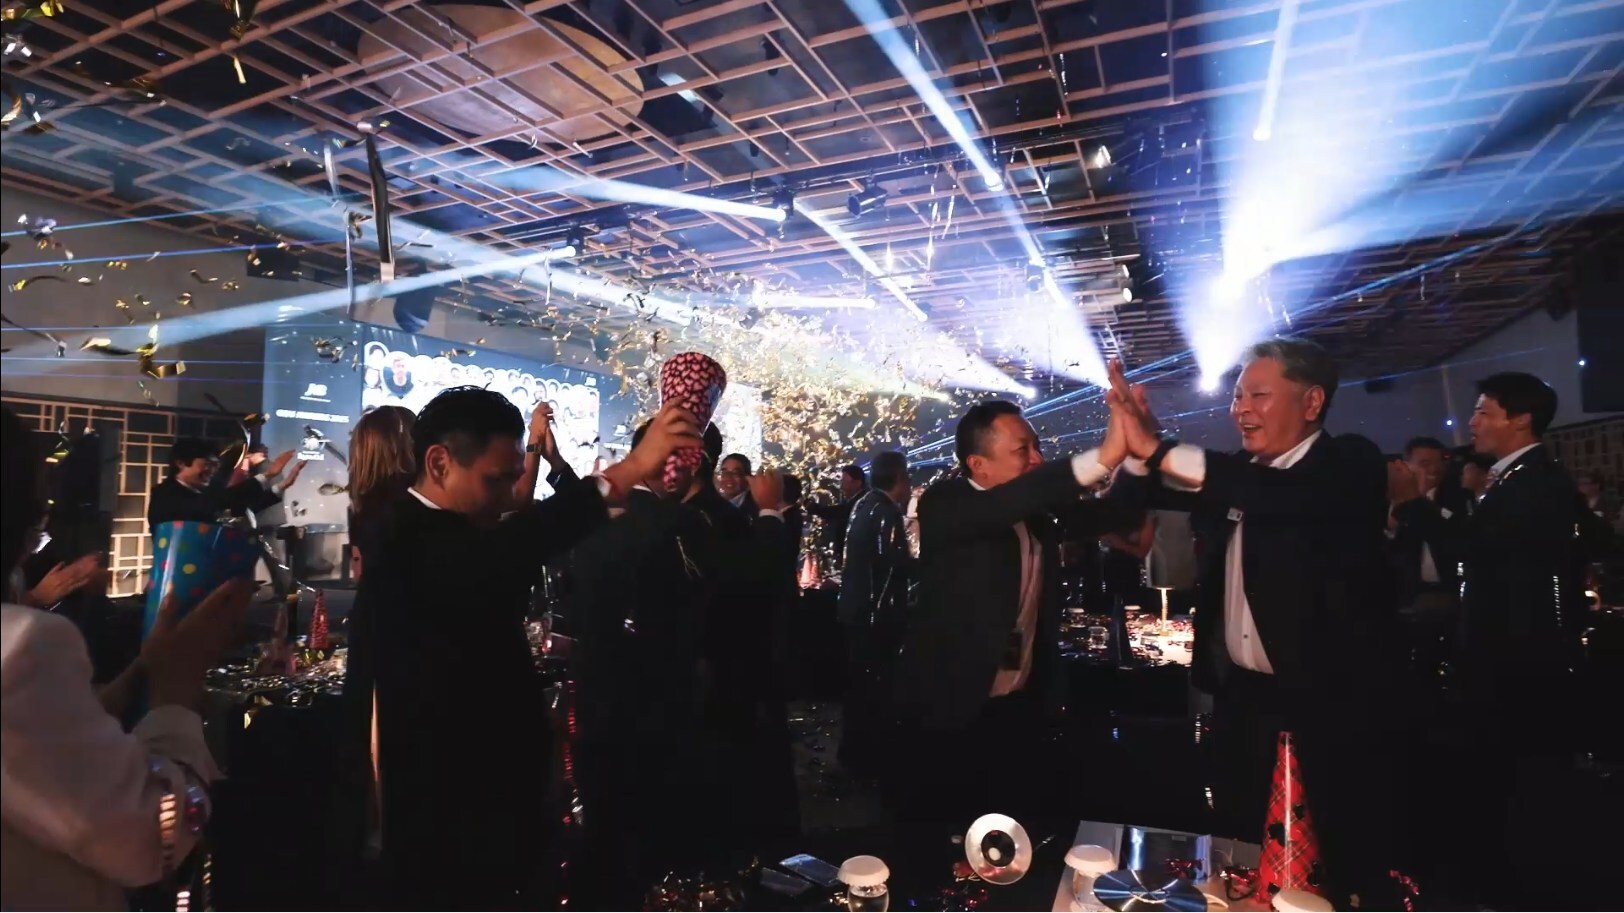
One participatory moment involving party poppers and high-fives coincided with the strongest aggregate outputs among the analyzed segments on the focal measures.
Another notable moment came when Mr. Garcia, who was preparing to retire after more than 50 years in the industry, received a commemorative gift from the new president. Because the analysis is time-aligned to the event, that segment can be located in the series and compared with the content around it.

A content category that occupied a substantial share of analyzed event time also showed comparatively lower aggregate outputs. Because time share and output level are separate measures, this pattern is best treated as a design hypothesis rather than a causal conclusion. For the next event, planners could test whether adjusting the content mix or pacing changes the audience response pattern.
These observations suggest questions for the next event: whether a different content mix changes the pattern, whether shorter presentation blocks change it, where a participatory moment works best in the agenda, and how transitions behave.
From Engagement Data to Data-Driven Event Design
The value of engagement analytics lies in the decision loop: define an objective, collect evidence, add time and context, form a hypothesis, and test it at the next event.
Define objective → Collect multiple signals → Add time and context → Form a design hypothesis → Test in the next event
Before the Event: Use Past Insights to Shape the Agenda
Start with the event objective and the decisions measurement should inform. Use past-event findings to shape agenda choices, but treat them as inputs to a new hypothesis rather than universal rules. Questions such as "Should the executive keynote open or close the day?" or "Is this breakout format working for this audience?" are more actionable than "How engaged were people?"
Then select the evidence mix that can answer those questions and decide what contextual record you will need. Accurate agenda timings, production notes, and unplanned changes make later analysis interpretable rather than merely suggestive.
During the Event: Monitor Audience Response
During the event, monitor the signals that are actually available in the approved measurement plan, such as participation, polls and Q&A, digital activity, and operational context. Accurate timing matters for later alignment, and details such as a late start, room change, or technical interruption may help explain patterns.
Where an implementation supports live time-based response monitoring and the governance model allows it, those signals could add another layer.
After the Event: Analyze, Learn and Improve
After the event, bring the evidence together before drawing conclusions from one source. Compare time-based patterns with participation data, direct feedback, and the event timeline where available. Convergence strengthens a hypothesis; divergence can be informative too.
Separate what you observed from what you think explains it, then make the hypothesis testable through a change to the agenda, content, format, or production plan. Measure the same way next time and compare. The next event becomes a test of the hypothesis.
How Engagement Data Can Support Event ROI
Engagement data becomes more valuable when connected to business outcomes. Time-based response data can help planners understand which moments may be contributing to attention and participation, while objective-specific measures such as NPS, pipeline, other business outcomes, and cost show how the event performed against its goals. Used together, these signals provide a stronger basis for ROI/ROO evaluation and for decisions about future event design.
In this role, engagement data acts as diagnostic evidence: it helps planners interpret what happened during the event, identify design hypotheses, and decide what to test next.
For organizations managing measurement, governance, and ROI/ROO across an entire meetings and events program, Strategic Meetings Management provides the broader program-level context.
Responsible Use of Emotion Data
Responsible use starts with treating facial-expression data as one contextual signal within a broader measurement framework. A major review of the scientific evidence finds limited reliability and specificity in mappings between facial movements and discrete emotions, with substantial variation by person, culture, and context. A more recent systematic review of dynamic facial-expression databases also points to gaps in emotion operationalization, validation, generalizability, and ethics.
For any deployment, organizers should define how participants are informed, what the data is used for, whether individuals can be identified, how data is minimized and retained, and which AI-governance and privacy requirements apply. These questions require appropriate internal and legal review.
Frequently Asked Questions
How do you measure event engagement?
Use a mix aligned to the event objective: attendance and participation, polls and Q&A, app or digital activity, and direct feedback such as surveys or NPS. No single metric captures the whole attendee experience.
Can emotion data replace surveys or NPS?
Emotion data is most useful as a complement to surveys and NPS. Time-based response data can show when group-level patterns changed, while surveys and direct feedback explain the experience in attendees' own words. Together, they provide richer context than either source alone.
Can facial-expression data show how individual attendees truly feel?
Facial-expression data is better suited to identifying aggregate group-level response patterns than to interpreting an individual attendee's internal emotional state. Because facial movements vary by person, culture, and context, aggregate analysis should be interpreted alongside other evidence.
How does event engagement relate to event ROI?
Engagement evidence can strengthen ROI/ROO evaluation by helping planners understand what happened during the event and what to improve next. Event ROI itself is evaluated against business objectives, outcomes, value, cost, and an appropriate attribution approach, with engagement data providing additional diagnostic context.
Build More Measurable Events with JTB
What JTB Can Support
JTB supports organizations across the event lifecycle, from event strategy and content planning through production, staging, video, MC, operations, measurement, analysis, and continuous improvement. The pilot described here shows how time-based response data can sit alongside conventional engagement signals within that broader M&E approach, rather than as a standalone measurement solution.The opportunity is not simply to measure more. It is to learn what matters — and use that insight to design the next experience better.
The Future of Data-Driven Event Design
The longer-term opportunity is to make event design increasingly testable and iterative. By combining time-based group response with surveys, participation data, operational context, and business objectives, planners can identify moments that matter, form design hypotheses, and use the next event to learn again.
JTB brings together event strategy, creative and production expertise, operational delivery, and data-driven measurement to help organizations continuously improve the impact of their events. Explore JTB Event Solution to see how JTB supports this cycle from strategy and delivery through measurement and ongoing optimization.